This week I’m focusing on ROC curves in dentistry and the different imaging modalities (primarily film versus digital). As these numbers can change based on the research being performed and the reviewers of those radiographs, I thought the best way to break this all down is to give a short synopsis of each article and then sum it up at the end with the take-home points.
1) Ink-jet print out of radiographs on transparent film and glossy paper versus monitor display by Sebastian Kühl et al. in Clinical Oral Investigations June 2011.
This article was comparing the sensitivity and specificity of viewing radiographs on a monitor versus those printed out on glossy paper (photo paper essentially) and transparent film (actual film radiograph produced). They were evaluating overall differences in gray scale contrast and how well those differences were detectable. (For a review on kVp and grayscale, go here) They found that both monitor viewing (they did not specify the monitor settings or unit) and glossy paper print outs had higher ROC curves (0.83) versus the transparent film print outs (0.79). The concerns with this article is that 30 subjects were viewing the radiographs. That is a large number and it does not state whether these viewers were calibrated prior to this study and what their background training is (ie, dental student vs dentist vs oral and maxillofacial radiologist). I did find it interesting that the glossy paper print out was higher than the transparent film print out.
2) Comparing the accuracy in Diagnosing Periapical Lesions by Conventional and Direct Digital Radiography by Ajay Parihar et al. in Journal of Indian Academy of Oral Medicine and Radiology October – December 2010.
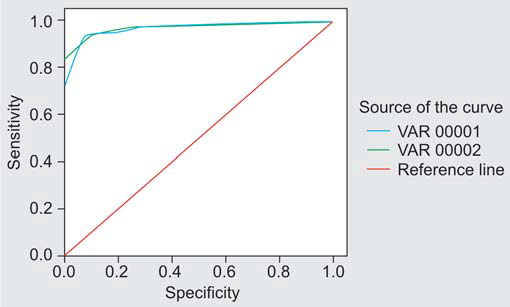
This article evaluated periapical lesions between analog film (E-speed) and sensors (Kodak 5000 CMOS). This study had only 3 viewers (two oral and maxillofacial radiologists and one endodontist). Interestingly they only evaluated mandibular first molars. The final ROC curves were quite high for both systems; analog film = 0.971 and sensors = 0.970. This study showed that both systems were comparable for periapical lesions. I would have liked to see more imaging modalities being evaluated (granted that does mean more radiation exposure to the patient which is not good – hmm a little catch 22 there).
 This graph shows how high the ROC curves were
(nearly perfect systems according to this study)
3) Diagnostic accuracy of small volume cone beam computed tomography and intraoral periapical radiography for the detection of simulated external inflammatory root resorption by C. Durak et al. in International Endodontic Journal 2011.
This study used intraoral periapical radiographs (phosphor plates – Optime) and cone beam CT (3D Accuitomo 80, J. Morita) to evaluate simulated external root resorption of mandibular incisors. They found that the ROC curves for the CBCT were significantly higher (0.984 to 0.990) versus the intraoral periapical radiographs (0.665). The reviewers for this study were all endodontists or endodontists to be. A large reason the numbers are so skewed is due to the size of simulation external root resorption. The smaller the simulated external root resorption, the less likely it was detected on periapical radiographs. One thing I would have liked to seen would be an oral and maxillofacial radiologist also included in this study for a baseline of all the reviewers.
Summary
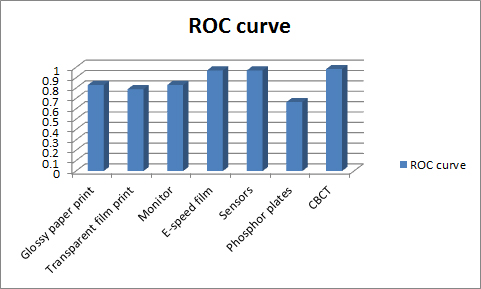
These three articles are by in no means all encompassing but they do show a mixed sort of different types of radiographs a typical dental office may come across. So here’s a table summary of all the different viewing of radiographs.
Looking at the table, you’ll notice that the majority of the viewing modalities are very similar. This shows no major difference between the different film and digital systems when evaluating for different pathological entities. The phosphor plates are noticeably lower but again this must be taken with a grain of salt as it was compared to a cone beam CT and these are two very different imaging modalities.
Should you have any questions or thoughts on this topic, please let me know.
Thanks and enjoy!

Thanks for include my study in this topic. It’s very old study study conducted in 2003-2005.
You’re welcome. ☺️ I was asked to do a post on ROC curves and the research I could find at the time was limited.